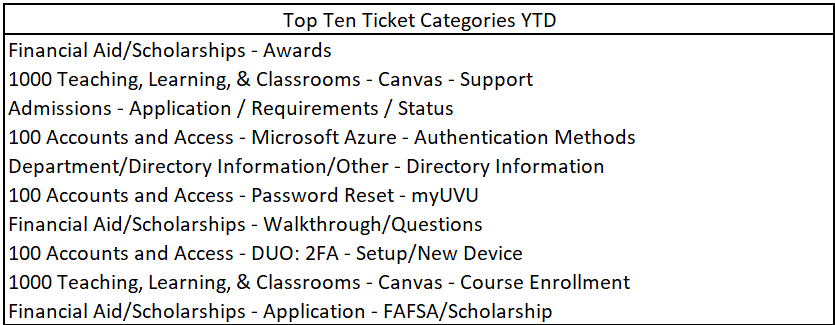
May 2022 Enterprise Service Desk Statistics

May YTD Tickets

May Chats taken

May total calls served

May avg call duration

May call volume

Past Enterprise Service Desk Statistics

December 2021

January 2022

February 2022

March 2022

April 2022

Glossary of Terms

Ticket Categories

  • Each time someone contacts the Service Desk, regardless of the type of contact, a ticket is made that describes the type of question the interaction was about. This lists the top ten types of questions we’ve answered so far this year.

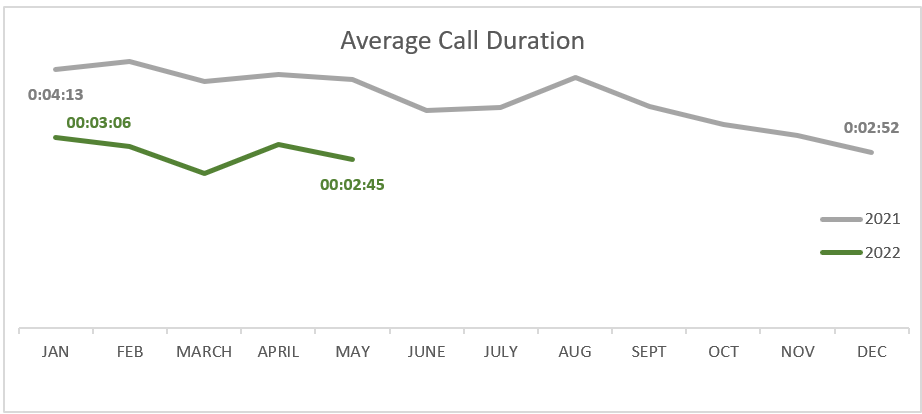
Average Call Duration YTD

  • The average time each phone call lasted. This graph shows from January to the current month.

Chats Taken

  • The number of times someone contacted the Service Desk through a chat.

Average Call Volume

  • The number of times someone contacted the Service Desk through a phone call.
 
Headshot of Wilson the Wolverine

Questions? Ask Wilson